T.C.
GÜMRÜK VE TİCARET BAKANLIĞI
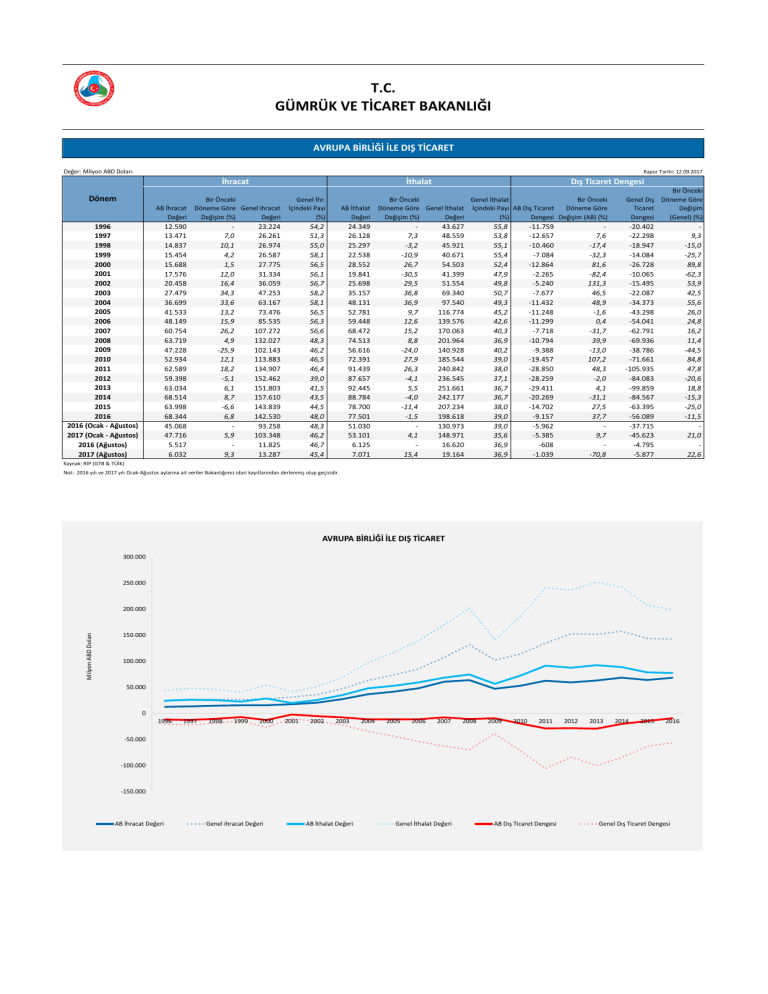
AVRUPA BİRLİĞİ İLE DIŞ TİCARET
Değer: Milyon ABD Doları
Rapor Tarihi: 12.09.2017
İhracat
Dönem
AB İhracat
Değeri
1996
1997
1998
1999
2000
2001
2002
2003
2004
2005
2006
2007
2008
2009
2010
2011
2012
2013
2014
2015
2016
2016 (Ocak - Ağustos)
2017 (Ocak - Ağustos)
2016 (Ağustos)
2017 (Ağustos)
İthalat
Bir Önceki
Döneme Göre Genel ihracat
Değişim (%)
Değeri
12.590
13.471
14.837
15.454
15.688
17.576
20.458
27.479
36.699
41.533
48.149
60.754
63.719
47.228
52.934
62.589
59.398
63.034
68.514
63.998
68.344
45.068
47.716
5.517
6.032
7,0
10,1
4,2
1,5
12,0
16,4
34,3
33,6
13,2
15,9
26,2
4,9
-25,9
12,1
18,2
-5,1
6,1
8,7
-6,6
6,8
5,9
9,3
Genel İhr.
İçindeki Payı
(%)
AB İthalat
Değeri
54,2
51,3
55,0
58,1
56,5
56,1
56,7
58,2
58,1
56,5
56,3
56,6
48,3
46,2
46,5
46,4
39,0
41,5
43,5
44,5
48,0
48,3
46,2
46,7
45,4
24.349
26.128
25.297
22.538
28.552
19.841
25.698
35.157
48.131
52.781
59.448
68.472
74.513
56.616
72.391
91.439
87.657
92.445
88.784
78.700
77.501
51.030
53.101
6.125
7.071
23.224
26.261
26.974
26.587
27.775
31.334
36.059
47.253
63.167
73.476
85.535
107.272
132.027
102.143
113.883
134.907
152.462
151.803
157.610
143.839
142.530
93.258
103.348
11.825
13.287
Dış Ticaret Dengesi
Bir Önceki
Genel İthalat
Bir Önceki
Döneme Göre Genel İthalat İçindeki Payı AB Dış Ticaret
Döneme Göre
Değişim (%)
Değeri
(%)
Dengesi Değişim (AB) (%)
7,3
-3,2
-10,9
26,7
-30,5
29,5
36,8
36,9
9,7
12,6
15,2
8,8
-24,0
27,9
26,3
-4,1
5,5
-4,0
-11,4
-1,5
4,1
15,4
43.627
48.559
45.921
40.671
54.503
41.399
51.554
69.340
97.540
116.774
139.576
170.063
201.964
140.928
185.544
240.842
236.545
251.661
242.177
207.234
198.618
130.973
148.971
16.620
19.164
55,8
53,8
55,1
55,4
52,4
47,9
49,8
50,7
49,3
45,2
42,6
40,3
36,9
40,2
39,0
38,0
37,1
36,7
36,7
38,0
39,0
39,0
35,6
36,9
36,9
-11.759
-12.657
-10.460
-7.084
-12.864
-2.265
-5.240
-7.677
-11.432
-11.248
-11.299
-7.718
-10.794
-9.388
-19.457
-28.850
-28.259
-29.411
-20.269
-14.702
-9.157
-5.962
-5.385
-608
-1.039
7,6
-17,4
-32,3
81,6
-82,4
131,3
46,5
48,9
-1,6
0,4
-31,7
39,9
-13,0
107,2
48,3
-2,0
4,1
-31,1
27,5
37,7
9,7
-70,8
Bir Önceki
Genel Dış Döneme Göre
Ticaret
Değişim
Dengesi
(Genel) (%)
-20.402
-22.298
-18.947
-14.084
-26.728
-10.065
-15.495
-22.087
-34.373
-43.298
-54.041
-62.791
-69.936
-38.786
-71.661
-105.935
-84.083
-99.859
-84.567
-63.395
-56.089
-37.715
-45.623
-4.795
-5.877
9,3
-15,0
-25,7
89,8
-62,3
53,9
42,5
55,6
26,0
24,8
16,2
11,4
-44,5
84,8
47,8
-20,6
18,8
-15,3
-25,0
-11,5
21,0
22,6
Kaynak: RİP (GTB & TÜİK)
Not: 2016 yılı ve 2017 yılı Ocak-Ağustos aylarına ait veriler Bakanlığımız idari kayıtlarından derlenmiş olup geçicidir.
AVRUPA BİRLİĞİ İLE DIŞ TİCARET
300.000
250.000
Milyon ABD Doları
200.000
150.000
100.000
50.000
0
1996
1997
1998
1999
2000
2001
2002
2003
2004
2005
2006
2007
2008
2009
2010
2011
2012
2013
2014
2015
2016
-50.000
-100.000
-150.000
AB İhracat Değeri
Genel ihracat Değeri
AB İthalat Değeri
Genel İthalat Değeri
AB Dış Ticaret Dengesi
Genel Dış Ticaret Dengesi

